
Data Analysis
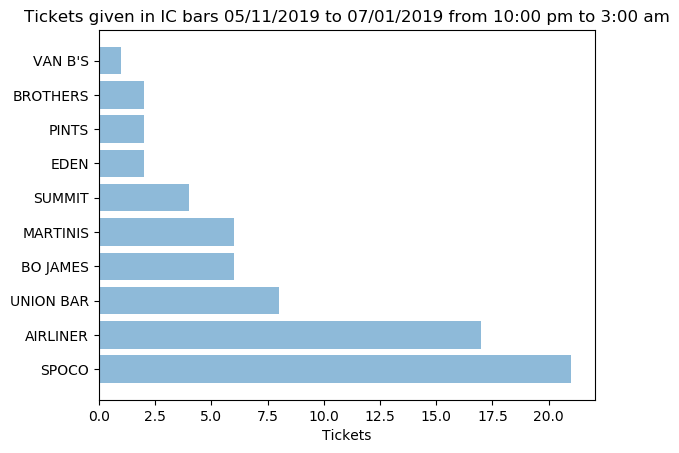
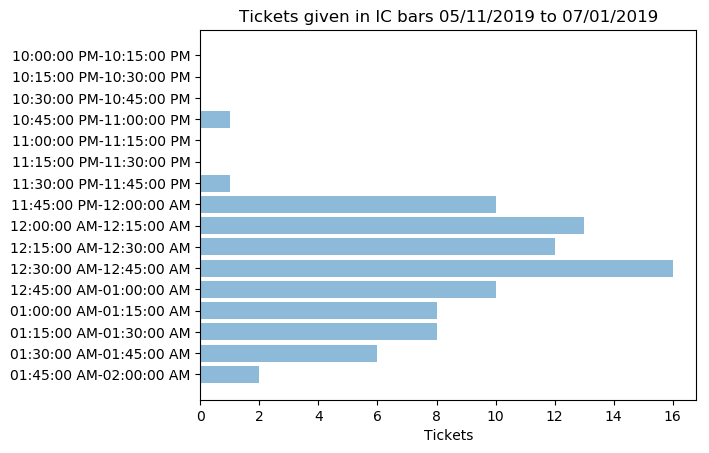
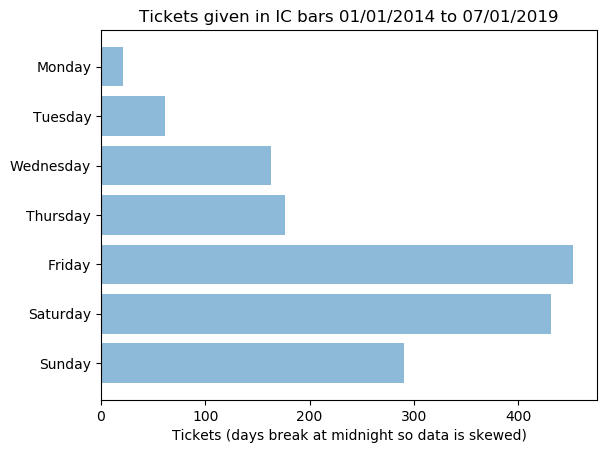
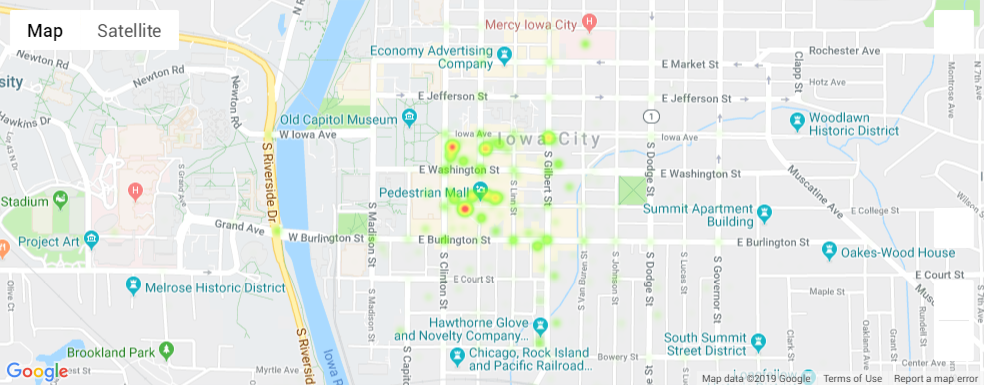
Project to track police activity in Iowa City with a focus on alcohol related arrests. This project takes data about arrests from the Iowa City arrests blotter and plots the data in an interesting manner. The data used comes from an excel sheet originally recieved from the IC police department with info about alcohol realated arrests from 1/1/2014-5/6/2019. In addition to this data, to keep the information up to date I wrote a web-scraping python script to pull data from https://www.iowa-city.org/icgovapps/police/activitylog. Info pulled from police blotter includes date, time, location, charge, name of arrestee, name of officer making arrest and DOB of arrestee. The location is then taken and using google maps api translated to latitude and longitude which is used to relate the arrest to the location where the incident occured. From this data I was able to create some interesting displays and a heat map of the behavior of the police and individuals involved in these incidents. See pictures for examples of graphs program can produce.
Examples of graphs program can produce--
